The Six Sigma Handbook, Fifth Edition

Green Belt Overview Questions

1) Which of the following are NOT parts of Deming’s system of profound knowledge.
Feedback:

Deming described a system of “profound knowledge.” Deming’s system of profound knowledge consists of four parts: appreciation for a system, knowledge about variation, theory of knowledge, and psychology. A system in a network of interdependent components that work together to accomplish the aim of the system. The system of profound knowledge is itself a system. The parts are interrelated and cannot be completely understood when separated from one another. Systems must be managed, the greater the interdependence of the various system components, the greater the need for management. In addition, systems should be globally optimized; global optimization cannot be achieved by optimizing each component independent of the rest of the system. Systems can be thought of as networks of intentional cause-and-effect relationships. However, most systems also produce unintended effects. Identifying the causes of the effects produced by systems requires understanding of variation — part 2 of Deming’s system of profound knowledge. Without knowledge of variation people are unable to learn from experience. There are two basic mistakes made when dealing with variation: 1) reacting to an outcome as if it were produced by a special cause, when it actually came from a common cause, and 2) reacting to an outcome as if it were produced by a common cause, when it actually came from a special cause. Deming’s theory of profound knowledge is based on the premise that management is prediction. Deming, following the teachings of the philosopher C.I. Lewis, believed that prediction is not possible without theory. Novelist/philosopher Ayn Rand defines theory as “A set of abstract principles purporting to be either a correct description of reality or a set of guidelines for man’s actions. Correspondence to reality is the standard of value by which one estimates a theory.” Deming points out that knowledge is acquired as one makes a rational prediction based on theory, then revises the theory based on comparison of prediction with observation. Knowledge is reflected in the new theory. Without theory, there is nothing to revise, i.e., there can be no new knowledge, no learning. The process of learning is operationalized by Deming’s Plan-Do-Study-Act cycle (a modification of Shewhart’s Plan-Do-Check- Act cycle). It is important to note that information is not knowledge. Mere “facts” in and of themselves are not knowledge. Knowing what the Dow Jones Industrial Average is right now, or what it has been for the last 100 years, is not enough to tell us what it will be tomorrow. Psychology is the science that deals with mental processes and behavior. In Deming’s system of profound knowledge, psychology is important because it provides a theoretical framework for understanding the differences between people, and provides guidance in the proper ways to motivate them.

2) Systems are improved:
3) A company optimizes its processes to more quickly bring new product to market. This approach:
Feedback:

Improving your ability to bring unwanted products or services to market will not meet customers' demands or needs with any degree of certainty. Rather, identifying customer value and optimizing processes to meet that definition improve a company's ability to service its customers and thus remain profitable in the long term.

4) Which of the following is NOT one of Deming's 14 points?
Feedback:

Point 11 states "Eliminate numerical quotas for the work force and numerical goals for management".

5) Six Sigma methodologies:
6) If you estimate your Cost of Quality as 7% of sales, and your overall DPMO is about 20,000, then:
Feedback:

Although a DPMO of 20,000 equates to (approximately) a 3.5 Sigma Level (Appendix Table 9), the best answer is "all of the above", since the reported Cost of Quality would indicate a much better Sigma Level (Figure 1.3). When the Cost of Quality is underreported, then a Hidden Factory is at work masking those activities. (References from Six Sigma Demystified by Keller).

7) Metrics used for Six Sigma projects will usually relate to
8) Which of the following is NOT a desirable characteristic for a Black Belt:
Feedback:

Successful change agents should be non-confrontational in their approach.

9) A top-down deployment of Six Sigma Projects:
10) The prime purpose of top-down training is:
11) Effective leaders:
12) Effective managers:
13) A key objective of Six Sigma management training is to:
Feedback:

You can't force management to be involved. They must see leading the Six Sigma effort as a natural extension of their responsibilities. Their commitment cannot be verified in training, but should be seen by the results obtained and the effort put forth over a period of time. It is their leadership, not that of Black Belts, that will ensure program success and business success, which are inherently linked.

14) Management can demonstrate a leadership role in a Six Sigma deployment by:
15) A key objective for an initial wave of Six Sigma training is to:
Feedback:

A Six Sigma level of performance for a key process is an unlikely outcome of the first wave of training. It is more important to involve key high-profile management and a select team for Black Belt and Green Belt training, than to try to train too many participants.

16) A key consideration for selection of a Six Sigma project for the first wave is:
Feedback:

In the first wave of Six Sigma training and deployment, it is most important to select projects with achievable objectives (a high probability of success), whose results will be recognized throughout the organization, such as high profile customer issues. These may or may not be key customer issues, and will most likely not be the projects with the best return to the organization.

17) It is most important for Champions to develop the ability to:
Feedback:

Black Belts, not Champions, lead Six Sigma projects.

18) When considering Black Belt candidates:
19) The success of a Six Sigma effort requires:
20) The non-conformance records for the Painting Dept. are as follows, where the number reported is the number of defective units for each non-conformance type (cracked, chipped, off-color, wrong color, other):

Month
Total Shipped
Cracked
Chipped
Off Color
Wrong Color
Other
JAN
3500
7
15
21
12
200
FEB
3124
14
10
28
23
1
MAR
1245
12
5
11
17
9
APR
2020
18
9
7
11
5
MAY
1652
9
14
4
21
9
JUN
2637
11
21
26
9
13
JUL
2543
12
11
19
23
2
AUG
4042
8
12
12
18
1
SEP
1367
11
13
15
21
7
OCT
3124
21
9
13
40
7
NOV
2645
12
7
6
31
9
DEC
1200
10
4
14
17
8

Based on this information, which of the following project scope statements is best suited to maximize future benefit to the company:

Feedback:

The Other category is only the highest because of a single month with an exceptionally large non-conformance. This illustrates the inadequacy of Pareto charts alone for highlighting problem areas, since the Pareto cannot determine if the problem area represents a common occurrence (i.e. a common cause) or an anomaly (i.e. a special cause). Special causes of variation may not re-occur, so can't offer the same financial savings as elimination of common causes of variation. The special cause noted in January for Other has yet to be repeated over the course of the year, and may have already been addressed as an operational issue. The Wrong Color category is next highest on the Pareto based on count, so is the best choice for a project based on the information provided. Choice b is inadequate in defining what will be addressed.

21) The non-conformance records for the Painting Dept. are as follows, where the number reported is the number of defective units for each non-conformance type (cracked, chipped, off-color, wrong color, other):

Month
Total Shipped
Cracked
Chipped
Off Color
Wrong Color
Other
JAN
3500
7
15
21
12
200
FEB
3124
14
10
28
23
1
MAR
1245
12
5
11
17
9
APR
2020
18
9
7
11
5
MAY
1652
9
14
4
21
9
JUN
2637
11
21
26
9
13
JUL
2543
12
11
19
23
2
AUG
4042
8
12
12
18
1
SEP
1367
11
13
15
21
7
OCT
3124
21
9
13
40
7
NOV
2645
12
7
6
31
9
DEC
1200
10
4
14
17
8

Consider also the following unit costs for each type of failure:

      Cracked: $428.25 (cost of scrap material and labor)
      Chipped: $252.15 (rework cost)
      Off Color: $275.33 (rework cost)
      Wrong Color: $117.53 (cost of carrying unordered product in inventory)

Based on this information, which of the following project scope statements is best suited to maximize benefit to the company?

Feedback:

The cost to the company for the year given was as follows:

      Cracked= 145 * 428.25 = $62,096.25
      Chipped: = 130 * 252.15 = $32,779.50
      Off Color= 176 * 275.33 = $48,458.08
      Wrong Color= 243 * 117.53 = $28,559.79

Cracks represent a better financial payback (in the absence of data comparing the cost to deploy the different improvement projects, and assuming a constant percentage of defect reduction across all projects)

22) The non-conformance records for the Painting Dept. are as follows, where the number reported is the number of defective units for each non-conformance type (cracked, chipped, off-color, wrong color, other):

Month
Total Shipped
Cracked
Chipped
Off Color
Wrong Color
Other
JAN
3500
7
15
21
12
200
FEB
3124
14
10
28
23
1
MAR
1245
12
5
11
17
9
APR
2020
18
9
7
11
5
MAY
1652
9
14
4
21
9
JUN
2637
11
21
26
9
13
JUL
2543
12
11
19
23
2
AUG
4042
8
12
12
18
1
SEP
1367
11
13
15
21
7
OCT
3124
21
9
13
40
7
NOV
2645
12
7
6
31
9
DEC
1200
10
4
14
17
8

Consider the following unit costs:

      Cracked: $428.25 (cost of scrap material and labor)
      Chipped: $252.15 (rework cost)
      Off Color: $275.33 (rework cost)
      Wrong Color: $117.53 (cost of carrying unordered product in inventory)

Also consider the following costs and time to deploy the proposed projects, assuming they each have an equal chance of success:

      Cracked: $40k cost; 30 weeks
      Chipped: $10k cost; 16 weeks
      Off Color: $25k cost; 14 weeks
      Wrong Color: $3k cost; 10 weeks

Based on this information, which of the following project scope statements is best suited to maximize benefit to the company:
Feedback:

A useful metric for determining the preferred project is the Pareto Priority Index (PPI), calculated as follows:

PPI = (Dollar Savings * Probability of Success) / (Implementation Cost * Completion Time)

The potential annual savings to the company for elimination of each defect is as follows (assuming constant volumes for future years):

      Cracked= 145 * 428.25 = $62,096.25
      Chipped: = 130 * 252.15 = $32,779.50
      Off Color= 176 * 275.33 = $48,458.08
      Wrong Color= 243 * 117.53 = $28,559.79

The PPI for each project is shown below:

      Cracked = 62,096.25 / (40,000 * 30) = 0.05
      Chipped = 32,779.50 / (10,000 * 16) = 0.20
      Off-Color = 48,458.08 / (25,000 * 14) = 0.13
      Wrong Color = 28,559.79 / (3,000 * 10) = 0.95

The Wrong Color project has the highest PPI, so is preferred. In this case, it also has the lowest cost/benefit ratio, the highest payback (benefit less cost), and the highest payback per week (of project time), making it the most attractive by those criteria as well.
23) Strategic Planning
24) An effective Strategic Plan should:
25) The stakeholders for a process improvement initiative in a Customer Service area are likely to include:
26) As a company moves from 3 Sigma level of Quality to 4 and 5 Sigma Levels of Quality, they tend to:
27) A company operating at three Sigma will experience costs of poor quality due to:
28) A call center for processing book orders is investigating their error rate. The procedure calls for the customer service representative to gather the following information for each order (those marked with an asterisk were determined to be critical to the processing of the order):

Name exactly as appears on credit card *

Billing Address exactly as on credit card statement *

Credit card number *

Credit card expiration date *

Ship to Address *

Product ID being ordered *

Quantity Ordered *

Source (i.e. how did you hear about us?)

Have you used our website?

If so, was it helpful?

In a sample of 4,000 orders, 700 errors are found on 200 of the orders. The DPMO is:
Feedback:

The DPO is calculated as:

DPO = 700 defects / (4,000 orders * 7 opportunities/order)

DPO = 0.025

The DPMO is then

DPMO = DPO * 1,000,000 = 0.025 * 1,000,000

DPMO = 25,000
29) The yield of a process, calculated as output divided by input:
Feedback:

The traditional yield calculation defined above ignores the Hidden Factory rework and waste, and does not consider the number and severity of defect types.

30) If the Rolled Throughput Yield for a four-step process is 95%, then a good target Throughput Yield for each step of the process is:
Feedback:

The Normalized Yield is:

Yn=(Yrt)1/n=(.95)1/4=.987
31) Dashboards which monitor results of employee surveys:
32) Dashboards which monitor feedback from customers:
33) Quality cost trend analysis is facilitated by comparing quality costs to:
Feedback:

The appropriate measurement base varies with the cost category and the audience.

The quality cost system should be developed jointly by the quality and accounting departments. The task of monitoring quality costs on an ongoing basis is normally the responsibility of the accounting department. Because of this, the quality cost system is often thought of as an accounting system. This is a mistake. The quality cost system is primarily a management information system. The point of making this distinction is that one should not go to extremes trying to get “to the penny” accuracy. By their very nature, quality costs are often difficult to determine and at times a good approximation is the best you will be able to get. But, usually, this is all you need to determine the appropriate management action.

Quality costs are an extremely important means for directing management action. They can also be very useful in helping management track the success of their quality improvement efforts. Ideally, the total Cost of Quality (COQ) will decline over time. Crosby (1979) recommends a 10% per year goal for reducing total COQ, but this figure seems somewhat arbitrary. A better approach would be based on a realistic assessment of the causes of current quality cost elements and an improved plan based on this assessment.
34) The basic objective of a quality cost program is to:
Feedback:

The basic objective of a quality cost program is profit improvement. A discussion of the relationship of quality costs and profits is given in Pyzdek, T., “The Impact of Quality Cost Reduction on Profits,” Quality Progress, Oct. 1976.

35) In estimating the cost of a project, all of the items below are crucial except:
Feedback:

In estimating the cost of a project, obtaining highly accurate cost estimates for all project expenses is neither crucial or practical.

36) In establishing a base line for a project it is important to:
Feedback:

In establishing a base line for a project it is important to involve the accounting and finance department when financial metrics are developed.

37) Joe's project seemed to be going along well until the project team started to implement the solution. At that point, a department that hadn't been involved, but will be affected, starting raising objections and pointing out problems to the proposed solution. This indicates:
Feedback:

The affected department is one of the stakeholders that should have been identified and included in the problem solving, if not the team itself. Involving the Sponsor should be a last resort. The team needs to satisfy the department's legitimate concerns, and help them understand why the proposed solution is the best course (if in fact it is, given the department's concerns).

38) Jill is the Team Leader for a project aimed at reducing the cycle time for invoices. The team has reached an impasse on generating potential root causes of process failure; only a few ideas have been offered by only a few of the team members. As team leader, Jill should:
Feedback:

Choice c best represents the concept of consensus decision making, which is preferable to voting or mandating decisions.

39) Joan is a Black Belt and project team leader. Her team includes, amongst other members, a manager and a clerk from different departments. Early in today's team meeting, after the clerk had offered an idea during brain-storming session, the manager made a joke about the feasibility of the idea. Just now, the manager has stifled the clerk's comments by asserting the clerk lacked the experience to suggest potential causes of the problem under investigation. Joan should:
Feedback:

The manager needs to conduct him or herself within the acceptable rules of conduct. Ground rules such as mentioned in Choice b are typical, as is a rule that employees' rank in the organization should not influence the team dynamics. A public reminder of the ground rules, done quickly and respectfully, shows the team that no one is above these rules. By addressing this concern immediately, the chance of future instances is reduced.

40) In an initial team meeting, the team should
41) A conflict has developed in a team member regarding a proposed solution. Joan, the team leader, should:
Feedback:

Conflict is necessary for ideas to be generated and discussed and should not be discouraged. Voting is not a preferred way to settle conflict. Conflicts should be resolved using consensus.

42) A Black Belt has been asked to put together a proposal for solving a particular customer problem. In doing so, she determines that the problem is quite widespread, with many manifestations and causes. As a result, her project plan requires a fifteen month deployment, with up to twenty stakeholder groups involved in the team. This project
Feedback:

Projects should be broken down to manageable projects lasting three to six months. Projects lasting longer than this are likely to lose support and team members, greatly reducing their chance of success.

43) The Grinding Dept. of your company is recognized as requiring improvement. Their rework rate averages 15%, with a scrap rate around 5%. A project scope defined as 'Reduce scrap in Grinding Department':
Feedback:

The scope as stated is too poorly focused to develop a plan, assemble a team of knowledgeable personnel, or understand the potential savings of implementation. The reasons for scrap, and the resulting costs, need to be more clearly understood so that a realistic plan can be developed for the project.

44) In a SIPOC analysis, stakeholders are usually:
45) In a SIPOC analysis, inputs include:
46) A graphical tool often used to help identify opportunities for improvement is:
Feedback:

A Pareto Analysis is a graphical tool often used to help identify opportunities for improvement.

47) A process currently operates at a 2.0 Sigma Level. A reasonable goal for a Six Sigma project is to:
Feedback:

Reasonable criteria, used by General Electric for establishing goals for Six Sigma projects, are:

      Sigma Level < 3 Sigma: 10 x reduction in defects
      Sigma Level > 3 Sigma: 50% reduction in defects.

Choices a and d are not generally realistic in a single short term project.
Choice c represents a 50% reduction, while choice b represents a reduction to one tenth of the current defect rate.
48) The following operations (with cycle times) are needed to release a customer order to production:

1. Define Bill of Materials: 2 days

2a. Order and receive materials (can be done concurrent with 2b): 10 days

2b1. Schedule job in production (can be done concurrent with 2a, but must be before 2b2 and 2b3): 3 day

2b2. Define quality plan for product (can be done concurrent with 2a, but must be after 2b1 and before 2b3): 1 day

2b3: Enter schedule and quality requirements into scheduling software (can be done concurrent with 2a, but must be after 2b1 and 2b2): 1 day.

3. Release to production

It is proposed to break Step 1 into two steps: Verify Bill of Materials (Step 1a) and Enter Bill of Material into production software (Step 2b0). Step 1a replaces Step 1 as the initial step of the process, requiring 1 day. Step 2b0, requiring one day, must take place before Step 2b1, but can be done concurrent with Step 2a. The net effect of this change on the total cycle time is:
Feedback:

Step 1a will remain on the critical path. The effect of moving Step 2b0 to run concurrent with Step 2a is to move it off the critical path, so the cycle time for the critical path is reduced by one day.

49) Which of the following statements is NOT true:
Feedback:

Customer satisfaction is a value judgment made by a customer regarding their total experience with your product or service. Quality is an absence of defects and the presence of desirable product or service features. Quality is one of many factors evaluated by customers when arriving at a satisfaction judgment.

50) Under the Kano model, which of the following is most likely to occur as a result of competitive pressure?
Feedback:

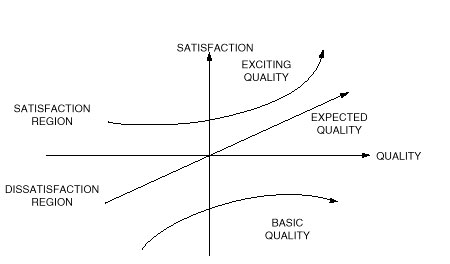
The Kano model shows that there is a basic level of quality that customers assume the product will have. For example, all automobiles have windows and tires. If asked, customers don’t even mention the basic quality items, they take them for granted. However, if this quality level isn’t met the customer will be dissatisfied; note that the entire “Basic Quality” curve lies in the lower half of the chart, which represents dissatisfaction. However, providing basic quality isn’t enough to create a satisfied customer. The expected quality line represents those expectations which customers explicitly consider. For example, the length of time spent waiting in line at a checkout counter. The model shows that customers will be dissatisfied if their quality expectations are not met; satisfaction increases as more expectations are met. The Kano model is shown below.

51) Under the Kano model, improvement of a basic quality feature has an effect on:
Feedback:

It will have no effect on “satisfaction.” The Kano model indicates that basic quality features, if not present, lead to dissatisfaction. The entire basic quality curve lies in the dissatisfaction region.

The Kano model shows that there is a basic level of quality that customers assume the product will have. For example, all automobiles have windows and tires. If asked, customers don’t even mention the basic quality items, they take them for granted. However, if this quality level isn’t met the customer will be dissatisfied; note that the entire “Basic Quality” curve lies in the lower half of the chart, which represents dissatisfaction. However, providing basic quality isn’t enough to create a satisfied customer. The expected quality line represents those expectations which customers explicitly consider. For example, the length of time spent waiting in line at a checkout counter. The model shows that customers will be dissatisfied if their quality expectations are not met; satisfaction increases as more expectations are met. The Kano model is shown below.

52) Which of the following are NOT customer contact worker (CCW) positions encountered in everyday life:
Feedback:

All of these are customer contact worker (CCW) positions encountered in everyday life.

A customer contact worker (CCW) is a person who routinely has direct personal contact with customers. The nature of the contact can be face-to-face encounters, telephone communication, or written correspondence. To customers, these worker are “the organization.” Considering this, the importance of CCWs to customer satisfaction is obvious. Despite their importance, CCWs are often among the least-experienced and lowest paid employees of the firm. The result is an epidemic of customer dissatisfaction that is well documented in the literature. CCWs are placed in “boundary positions” where the organization meets the outside world. This creates a number of stresses that are not experienced by other members of the organization. As outsiders, customers make demands upon the CCW. The CCW may not be able to meet the customer demands due to organizational policies and restrictions. In these situations, the CCW must represent the organization to the customer in a manner that doesn’t unduly anger or annoy the customer. Conversely, the CCW must present the customer’s perspective to the organization. Given the low status of many CCW positions, this represents a significant challenge. In these situations the CCW must represent the customer to the organization in a manner that doesn’t unduly anger or annoy their superiors in the organization. The CCW is constantly faced with these divided loyalties, and the result is often stress and confusion.
53) Which of the following are NOT included in the Kano quality model?
Feedback:

The Kano model is shown in the figure below.

54) The graph shown is interpreted as follows:

Feedback:

The figure, based on the Kano Model, describes a situation of dynamic customer perceptions which are influenced by many factors, including the competition. Studies of customer satisfaction have demonstrated convincingly that customer satisfaction is not solely determined by the manufacturer’s perception of the quality of the product or service; conformance to engineering requirements is an inadequate standard of quality. As the figure demonstrates, competitive pressure will make today’s wow features tomorrow’s must have features. Customer expectations tend to increase steadily over time.

55) The customer for a manufactured item is:
56) Customer satisfaction:
57) When evaluating the needs of external customers:
58) Improving customer satisfaction:
59) A customer-focused organization:
Feedback:

Prevention is the focus, rather than detection. Understanding customer needs is critical to this effort.

60) Key components of effective relationship management programs include:
61) Customer complaints may arise due to:
62) Evaluating customer complaints allows an organization to:
Feedback:

Complaints are not prevented, but detected at this point. There may be many other problems that customers don't bother to report.

63) When evaluating an organization's ability to meet a specific customer's demands
Feedback:

The specifications are often incomplete in addressing important customer issues, especially those related to service issues, such as delivery time. The specifications are often defined without regard to process optimization. In many cases, customers would prefer tighter restrictions on the process, so specifications are not useful for controlling processes. In addition, you'll learn in the Measure stage that the process should be controlled based on its statistical capabilities, rather than the specifications.

64) The non-conformance records for the Painting Dept. are as follows, where the number reported is the number of defective units for each non-conformance type (cracked, chipped, off-color, wrong color, other):

Month
Total Shipped
Cracked
Chipped
Off Color
Wrong Color
Other
JAN
3500
7
15
21
12
200
FEB
3124
14
10
28
23
1
MAR
1245
12
5
11
17
9
APR
2020
18
9
7
11
5
MAY
1652
9
14
4
21
9
JUN
2637
11
21
26
9
13
JUL
2543
12
11
19
23
2
AUG
4042
8
12
12
18
1
SEP
1367
11
13
15
21
7
OCT
3124
21
9
13
40
7
NOV
2645
12
7
6
31
9
DEC
1200
10
4
14
17
8

A reasonable goal for a Six Sigma improvement project is:

Feedback:

A reasonable criteria, used by General Electric for establishing goals for Six Sigma projects, is: Sigma Level < 3 Sigma: 10 x reduction in defects Sigma Level > 3 Sigma: 50% reduction in defects. Choices b through d are not generally realistic in a single short term project.

65) The following operations (with cycle times) are needed to release a customer order to production:

1. Define Bill of Materials: 2 days

2a. Order and receive materials (can be done concurrent with 2b): 10 days

2b1. Schedule job in production (can be done concurrent with 2a, but must be before 2b2 and 2b3): 3 day

2b2. Define quality plan for product (can be done concurrent with 2a, but must be after 2b1 and before 2b3): 1 day

2b3: Enter schedule and quality requirements into scheduling software (can be done concurrent with 2a, but must be after 2b1 and 2b2): 1 day.

3. Release to production

The earliest start time for step 2b2 is:
66) The following operations (with cycle times) are needed to release a customer order to production:

1. Define Bill of Materials: 2 days

2a. Order and receive materials (can be done concurrent with 2b): 10 days

2b1. Schedule job in production (can be done concurrent with 2a, but must be before 2b2 and 2b3): 3 day

2b2. Define quality plan for product (can be done concurrent with 2a, but must be after 2b1 and before 2b3): 1 day

2b3: Enter schedule and quality requirements into scheduling software (can be done concurrent with 2a, but must be after 2b1 and 2b2): 1 day.

3. Release to production

The latest start time for step 2b2 is:
67) Which of the following is the correct control chart for the waiting time for customers in a bank; each individual customer’s waiting time will be plotted.
Feedback:

Selecting the proper control chart for a particular data set is a simple matter if approached properly. The proper approach is illustrated in the figure below.

68) Determine the correct chart(s) for the salt content of potato chips using samples of three every 15 minutes.
Feedback:

Selecting the proper control chart for a particular data set is a simple matter if approached properly. The proper approach is illustrated in the figure below.

An X bar and range chart or an X bar and s chart can be used. The s chart is more accurate, but the range chart is easier to plot. The s chart can always be used in place of the range chart, but the range chart begins to lose accuracy as the sample size exceeds 5, and should not be used if the sample size is greater than 10.
69) A chart for number of defects is called:
Feedback:

C charts are statistical tools used to evaluate the number of occurrences-per-unit produced by a process. C charts can be applied to any variable where the appropriate performance measure is a count of how often a particular event occurs and samples of constant size are used. C charts answer the question “Has a special cause of variation caused the central tendency of this process to produce an abnormally large or small number of occurrences over the time period observed?”

70) The control chart that is most sensitive to variations in a measurement is:
Feedback:

X-bar and R charts use variables data, the other charts use attributes data. Thus, X-bar and R charts are more sensitive to measurement variation.

71) A p-chart has exhibited statistical control over a period of time. However the average fraction defective is too high to be satisfactory. Improvement can he obtained by:
Feedback:

While it is true that instituting 100% inspection will not improve the quality produced, it will improve the quality delivered to the customer.

72) The prime use of a control chart is to
Feedback:

Walter Shewhart’s main reason for inventing the control chart technique was to detect assignable causes of variation in the process.

73) Shewhart control charts are designed with which one of the following objectives?
Feedback:

Shewhart (1931, 1980) defined control as follows:

"A phenomenon will be said to be controlled when, through the use of past experience, we can predict, at least within limits, how the phenomenon may be expected to vary in the future. Here it is understood that prediction within limits means that we can state, at least approximately, the probability that the observed phenomenon will fall within the given limits."

The critical point in this definition is that control is not defined as the complete absence of variation. Control is simply a state where all variation is predictable variation. A controlled process isn’t necessarily a sign of good management, nor is an out-of-control process necessarily producing non-conforming product. In all forms of prediction there is an element of chance. For our purposes, we will call any unknown random cause of variation a chance cause or a common cause, the terms are synonymous and will be used as such. If the influence of any particular chance cause is very small, and if the number of chance causes of variation are very large and relatively constant, we have a situation where the variation is predictable within limits. You can see from the definition above, that a system such as this qualifies as a controlled system. Where Dr. Shewhart used the term chance cause, Dr. W. Edwards Deming coined the term common cause to describe the same phenomenon. Both terms are encountered in practice. Needless to say, not all phenomena arise from constant systems of common causes. At times, the variation is caused by a source of variation that is not part of the constant system. These sources of variation were called assignable causes by Shewhart, special causes of variation by Dr. Deming. Experience indicates that special causes of variation can usually be found without undue difficulty, leading to a process that is less variable.
74) An invoicing process generates only ten to fifteen orders per month. In establishing the statistical control of the invoice process:
Feedback:

Subgroups larger that one would include samples taken over too long a period, increasing the chance of including special causes.

75) An advantage of using Control Charts for individuals data is:
76) Which of the following charts may be used to plot the moisture level of a dried bean using samples of three beans every 15 minutes?
Feedback:

When the subgroup size is between 2 and 9, either a Range or Sigma chart may be used to estimate process variation for the X bar chart. The s chart is more accurate, but the range chart is easier to plot. The s chart can always be used in place of the range chart, but the range chart begins to lose accuracy as the sample size exceeds 5, and should not be used if the sample size is greater than 10.

77) When an X-Bar chart is used to control a process using a sample size of twelve:
Feedback:

The Range chart should not be used for subgroup sizes ten or larger.

78) If we replace the statistical control limits based on three standard deviations of the process statistic with those based on two standard deviations
Feedback:

Using two sigma limits in place of three sigma limits results in process tampering, which increases process variation.

79) It can generally be said that a control chart will:
Feedback:

A control chart will not detect all process shifts. Very small process shifts may never be detected. They are designed to have a very low false alarm rate.

80) When analyzing data from a Pareto chart of defect types,
81) The managers of a customer support hotline require that all issues be resolved within 72 hours of initiation (i.e. the resolution time must be less than 72 hours). To baseline the process, the team decides to control chart process data using an existing database containing the resolution times for each issue. The best chart to use in this application is:
Feedback:

When the cost of collecting data is not an issue, a variables control chart of a critical process parameter provides a much better control method than an attribute chart of the failure of the metric to fall within requirements. While the attribute chart provides an estimate of the error rate, the variables chart allows a more accurate prediction of longer-term error rates even when no errors have been observed.

82) A hospital is interested in control charting its mortality (death) rate for a surgical procedure. If the number of surgeries varies each month, the best control chart to use is the:
Feedback:

In estimating mortality for the surgical procedure, we should use the binomial distribution, since each sample (i.e. each patient) either lives or does not live. Since the number of samples each month varies, the p chart is the appropriate control chart.

83) A hospital is interested in control charting the number of "pain incidents" following a surgical procedure, where a "pain incident" occurs if a patient complains of excessive pain within ten days of the procedure, and a given patient may experience multiple pain incidents. The best control chart to use to plot the number of pain incidents per surgical procedure each month is the:
Feedback:

Since each patient can have multiple pain incidents, the Poisson distribution is the appropriate one to use. If the number of surgical procedures varies each month, then the u chart is best.

84) Key requirements for collecting samples of attribute data for control charting include:
85) If we count the number or errors in the process each month, and most of the months have no errors, with the remaining months having one error, then
Feedback:

We need sufficient resolution of the data to estimate the statistical properties of the process. A good rule of thumb is that we need an average count of 5 or more in each sample. If we observe less than that, then larger sample sizes are needed to estimate meaningful process statistics.

86) Histograms:
87) Samples taken from a process should be compared to:
Feedback:

Adjustments based on customer requirements is known as process tampering. The most recent sample provides insufficient information, and it should be assumed the process has some level of variation. Confidence intervals are appropriate for population estimates, not processes. Choice d refers to statistical control limits based on prior data.

88) If the process is in control, the level of common cause variation in the process helps us to
89) When reporting how well we meet our customer requirements:
Feedback:

The histogram of samples from a process does not provide evidence of statistical process control, and is misleading if the process is out of statistical control. Outliers from a sample may be representative of a process shift, and unless 100% inspection results from finding these outliers (which is not indicated by the question), the remainder of the shipment may contain additional outliers. Removing the outliers provides a misleading representation of the process sample to the customer.

90) In constructing a Scatter Diagram, it is customary to put the dependant variable on:
91) Positive correlation implies:
92) If the cycle time of a process is predicted by Cycle Time = 5.25 * (Number of items) + 4.3, with a correlation of 0.8, then the predicted cycle time for six items is:
Feedback:

Cycle Time = 5.25 * (6) + 4.3 = 31.5 + 4.3 = 35.8

93) Which of the following is a form of waste in Lean Thinking?

A. Errors requiring rework.

B. Work with no immediate customer, resulting in work in progress inventory.

C. Unnecessary process steps.

D. Waiting by employees as unfinished work is completed.

E. Design of product or processes that don't meet the customer's needs.
Feedback:

Womack and Jones offer each of these as types of waste.

94) An assembly process is receiving the incorrect pieces for assembly. To ensure that only the correct pieces are sent, the parts tub is redesigned so that only the correct pieces (at their correct number) can fit into the tub. This is an application of:
95) Increasing visibility in a process, from a lean perspective, is likely to:
96) How are the number of constraints in a system determined?
97) An example of a constraint is:
98) Which of the following is NOT a basic assumption related to Constraint Management?
99) When installing a new system for collecting failure data in a manufacturing plant, the following approach is recommended:
Feedback:

Systems work best when input for the design is received by all users of the system.

100) When quality improvement plans are implemented, an effective control plan includes training:
Submit Answers